
Based on the following technical and fundamental analysis below – both avenues support a gold price move to $2750 to $2900 inside 24 months. In the event of our forecast happening – Gold and Silver shares can double and treble over the next 2-3 years.
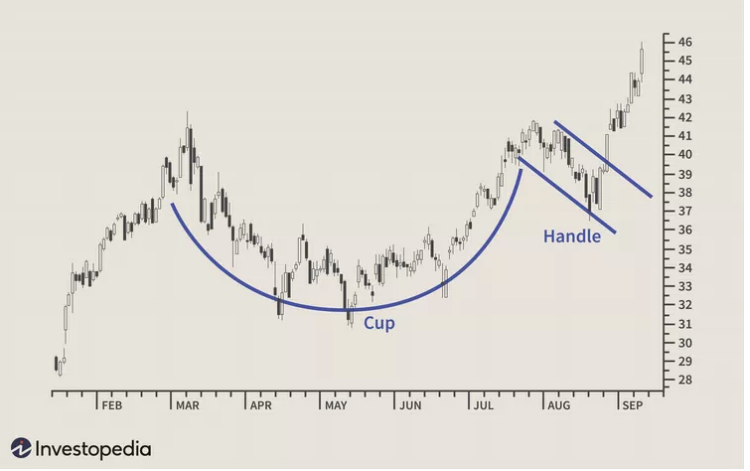
Below are two diagrams explaining the “cup & handle” technical chart projections for Gold Bullion – they project to $2700 from current $1845
The first wave up was from $1620 to $1970 (wave 1 of Elliot wave) from October 2022 to January 2023. The 2nd wave we think is starting now from $1811 and should go to around the $2400 – before a pullback and then final thrust to $2700 to $2900 in later part of 2024.
So, both the technical chart on Gold Bullion and the Elliot wave count have $2700 – $2900 gold price target inside 24 months. This means gold shares that are not leveraged (with debt) should double and potentially double twice over the next 24 months because of a fairly fixed overhead mining cost structure and a rising gold price that starts to go parabolic.
The last chart below IS the ACTUAL gold bullion price chart from 1997 to date – depicting the almost textbook cup and handle pattern – which projects to $2700 to $2900 – from the current $1980 level .
So, the technicals support being overweight gold shares for 2023 to 2024 – like they did in 2018 / 2019 when AngloGold went from R100 to R600 in 2 years (when the gold price went from 1200 to 2000 (we forecast that move as well).
I will list the fundamental reasons for the move up in Gold and silver bullion – below the technical chart below:
- The first two pictures / graphs depict the typical textbook “cup and handle chart pattern” which has been around for over 100 years in technical analysis in financial markets.
This can be googled anywhere. - The price pattern resembles a teacup & a handle to the teacup – and then the handle completes and breaks up it moves approximately the debt of the teacup added to the top of the cup over time.
- The third picture depicts the actual gold price over the last 25 years to date – where you can clearly see the pattern of a massive teacup and handle having formed – with the handle arguably breaking up as we type.
- It is our view (due to the fundamental reasons below) that the teacup is about to break up above the lip of the cup at $2000.
This then projects to $2700 to $2900 area over the next 12-24 months.

This is the actual gold price from 1997 to 2023 below picture – see how similar it is to the technical chart pattern – depicting a cup and handle of the tea cup:

US$ is the reserve currency of the world and it has $32 trillion dollars of debt (see US debt clock link at the bottom of this email, paste it and watch it – it is most intriguing as it goes up $1 million every 30 seconds). Investors are starting to move their money out of US$ to other assets (Gold, Silver, Platinum, Art – even Crypto which we do not believe in etc.) due to the concerns around the US$ government debt coupled with higher interest rates. The problem is the (US gov) interest on that debt has gone from 1% p.a. for 12 years – to 3.5% to 4.02%p.a. in the last 12 months.
The $ move against the Euro from 0.96 in July 2022 to 1.09 currently (in 9 months) is indicative of the concern of investors about the US$ as a currency / asset class & hence the weakening of the US$ (money flowing out of $ to other asset classes) and the move to assets without debt (gold, silver, platinum, art etc).
Gold has already moved from $1618 to $1982 in the same time frame as the $ has started to weaken – so the money flow is depicting a move from fiat printed money with debt to real hard assets (this is very common in times of stagflation which is what we are in now) .
The recent banking crisis in the US with 3 banks being rescued in the last 3 weeks and more recently Credit Suisse in Europe as well (SNB forced UBS to buy CS over a weekend) – is indicative of the debt (unrealized losses in US treasury bonds on US bank balance sheets) and interest spike rate “stress” in the global financial system.
You cannot raise rates this aggressively with so much debt and not enough collateral on the banks’ balance sheets & not expect a train wreck! Well so far there a 4 train wrecks in 3 weeks.
We sincerely believe that last night’s 25 bps rate hike will be the last hike and that the next direction will be 2% – 3 % cuts in US interest rates inside 12 -16 months to save the US and global banking system from a bank rout and contagion problems. US Bond Guru – Jeffrey Gundlach is forecasting 4 cuts in rates before end of 2023. Gundlach is 70% right on his forecasting.
Stagflation & high Inflation drives money to Gold bullion and silver: as stagflation bites (lower company profits hit growth due to the higher inflation = higher input costs = less net profits for company’s (add the cost of energy and Eskom and load shedding and company profits are under pressure with rising inflation; investors become disappointed with bond and equity returns (not beating inflation) and start moving money into alternative assets like gold and silver to try and beat inflation which remains buoyant.
NOTE: there is 200 trillion $ in global bond markets and $120 trillion in global equity markets (this is all investor money). So total of $320 trillion $ invested in these two traditional asset classes. The global precious metals market is US$ 300 Billion in value currently. When shares and bonds start underperforming stubbornly high inflation at 6% to 7% (globally) which is what is currently happening – the money starts moving to precious metals to try and beat inflation. The problem is that the size of the global bond and equity markets is $320 trillion combined, and the precious metals market is $300 billion. So, if just 10% of global equity and bonds moves to the gold / silver bullion markets – then these bullion market double. I suspect due to the nature of this inflation being so stubborn we may see more than 10% move from traditional investment asset classes (shares and bonds) to silver and gold to try and beat inflation in a stagflation environment.
So, this “rush to the hard assets” causes a “funnel rush phenomenon” (too much $ seeking bullion metals and not enough metal bullion around to buy) – bit like trying to fill your car with petrol fast…. causes Gold and Silver to move aggressively higher exponentially as more and more investors “stampede” / move from traditional assets classes underperforming inflation to “Real assets” that are not printed & are moving up faster than traditional asset classes (after years of suppression by the Central Banks to convince investors to remain in $ and bonds and equities) – i.e. instead of “paper assets” (shares and bonds) in an environment where the various Central Banks have lost control of inflation – gold bullion and silver then becomes a rush to asset class to get into and thus the exponential move up begins – we think $2700 minimum gold price inside 18 months.
The reason why Central Banks can’t fight inflation as they all have massive debt currently and if they continue to raise interest rates, they will go bankrupt (which means they can’t raise interest rates BUT yet they continue to “threaten” daily that they will – we believe the pivot to cutting interest rates is sooner than everyone thinks), as the 4% interest on $32 trillion of debt is attracting close to $2 trillion in interest payments each year. The 3 bank failures in the US recently (SVB bank was the 16th largest bank in the USA with a $216 billion failure – this is not small. This crisis is just beginning and when it becomes full blown – the rush out of the $ to metals (real hard assets will go parabolic).
This phenomenon is already beginning with the US$ losing close to 15% inside 9 months to the Euro & Gold Bullion moving from $1618 to $1982 today. These price movements depict what the “smart money” doing. The average investor has not even moved yet.
They US government used to pay 1% on $32 trillion debt for 12 years when growth was 4%: they now paying 3.5% -4.00% p.a. on an increasing $32 trillion debt pile with GDP at 2.5% and thus tax receipts declining (so more interest liability on less tax collection = a big problem). Thus, they will be forced to cut rates soon to reduce the debt interest burden for the US government & the US consumer. Yet everybody is too focussed on inflation. The current scenario risks deflation ahead or at worst stagflation & both lead rate cuts which is explosive for precious metals.
So, as the interest on their debt becomes too high and technically makes these governments insolvent – they will then be forced to cut rates to ensure they can pay the debt interest and also to ensure that the US economy does no go into a recession (i.e. help the US consumer on his credit card, mortgages and car finance etc) . Thus, cutting interest rates (we suspect in mid to early -2023) becomes an “igniter” for Gold and silver to break to new highs as lower rates causes the $ to weaken further and then people rush to gold and silver to beat inflation as they lose faith in the $ due to the massive debt behind this fiat currency.
Thus, they will eventually have to cut interest rates (sooner than later in my opinion) – to save the US from a banking crisis and interbank contagion & to stimulate the flagging US & European economies even when inflation is high, and this will cause Gold and silver to move sharply higher. (Rates being cut in a high inflation environment = explosive catalyst for precious metals) .
We think the next move in rates is lower from last nights “last 25 bps hike” – despite the FED “threatening” to go higher if inflation becomes a problem.
Thus, we sincerely believe a Banking crisis in the USA will eventually supersede the FED’s obsession with stubborn inflation globally when banks start folding daily; weekly & aggressive rate cuts will be the only solution in our opinion.
Powell did this exact “threat” of raising rates in 2018/early 2019 – he said 3 more hikes and 4 months later he pivoted (Trump induced) & in early 2019 he cut 3 times and Gold bullion went from $1200 to $1900 . We were involved in gold shares then as we saw the interest rate pivot coming. AngloGold went from R101 to R640 in 18 months.
We think Powell has no option again now but to pivot and start cutting rates in 2023 despite everyone thinking rates are going higher ! They can’t raise rates higher on $32 trillion of debt & when more banks start needing to be rescued then they will eventually cut rates to stabilize the balance sheets of the smaller banks and also the larger top 10 banks in the US which all hold US 10-year treasuries on their balance sheet as assets which are currently reflecting unrealized losses of around 25% to 30%. This is what caused the SVB failure (US 16th largest bank) and the run on their banking deposits.
Also, we think there is a risk of deflationary spiral in latter 2023 /2024 – which means they will cut rates aggressively to prevent deflation & this could be the alternative double catalyst – either way they are both very good for precious metals.
US $ debt clock : the below live debt clock depicts the US debt live: please click on the link or cut and paste to you google bar for a live feed on the US debt live.
 Approved by the FSCA | FSP Number 51362